Carbonz offers a work environment and a powerful LCA calculation engine developed by the R&D team of the Trace Group, designed to meet international standards and various labels worldwide. This engine is accessible via a specific API set for integration into other applications.
Carbonz provides real-time LCA calculation results after any input, precision, or project modification.
Contributors for RE2020
Visualization of CO² Equivalences
Visualisation des équivalences C0²
The Carbonz calculation engine delivers results for all indicators (according to the regulation and label sought) for each contributor across all life cycle phases.
// Carbonz in action
Contributors
The five contributors for RE2020 include:
Component Contributor: Covers all construction products and equipment in the building.
Energy Consumption Contributor: Covers regulated energy uses in the building and elevators.
Water Consumption and Discharge Contributor: Covers all water uses at the building scale.
Construction Site Contributor: Covers energy consumption, water consumption and discharge, waste evacuation and treatment during site preparation.
Parcel Contributor: Includes components necessary for works on the parcel outside the building, networks, energy production systems, parking areas, filling works, and potable water use for outdoor purposes, and wastewater treatment.
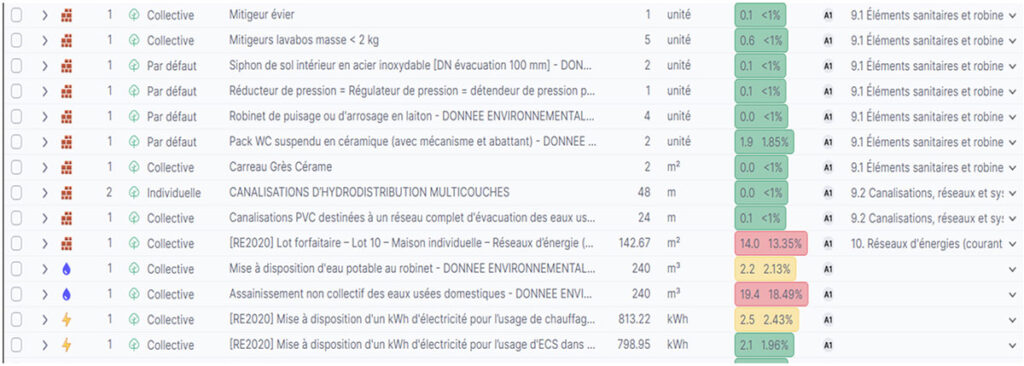
Carbonz calculates results instantly upon assigning environmental data. Results are directly visible in the contributor table:
The weight of the climate change impact of the contributor family is indicated at the project scale in tons CO² and percentage.
Carbonz displays the dynamic or static warming impact of environmental data distributed as a percentage of the total project, allowing optimization throughout the design process.
Result visualization is based on the selection of components or nodes and sub-nodes in the project tree:
Project
Site
Building
Zone
Contributors
Lots / Sub-lots
This enables visualizing results for a subset or a given lot and measuring its impact. Users can save visualization scenarios for their project, which can be displayed on the dashboard or in the general project report.
// Carbonz in action
Visualization of LCA and RE2020 Indicators
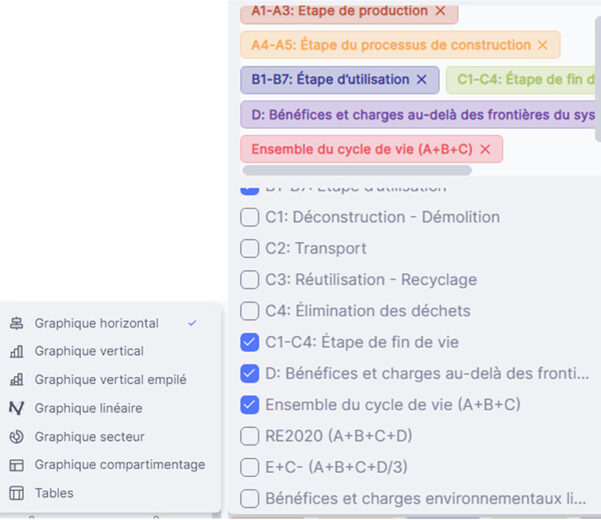
Beyond instant visualization in the contributor table, Carbonz presents ongoing LCA study results in intuitive tables or graphs according to NF EN 15978 standards, required labels, and life cycle stages.
Users select results based on the list of indicators, life cycle phases, and desired labels in table or graph form
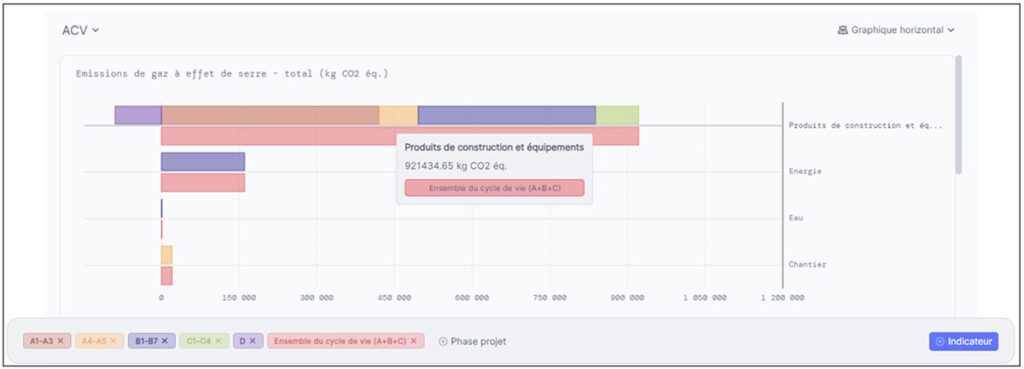
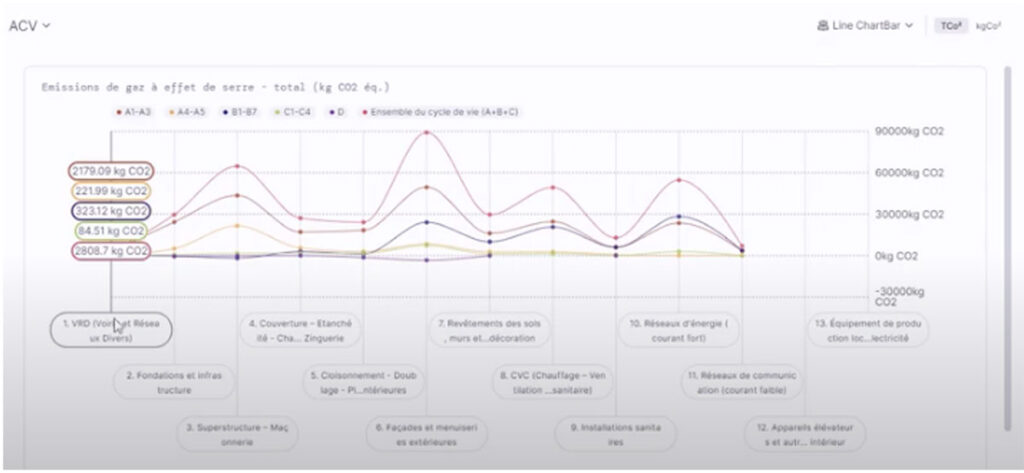
Graphical Result:
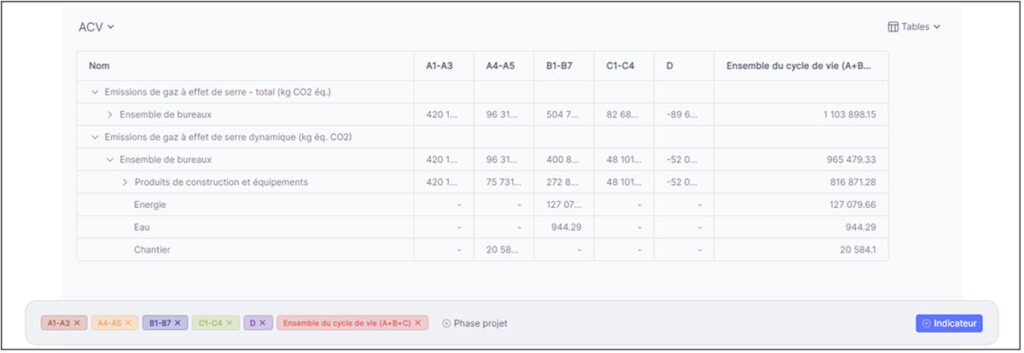
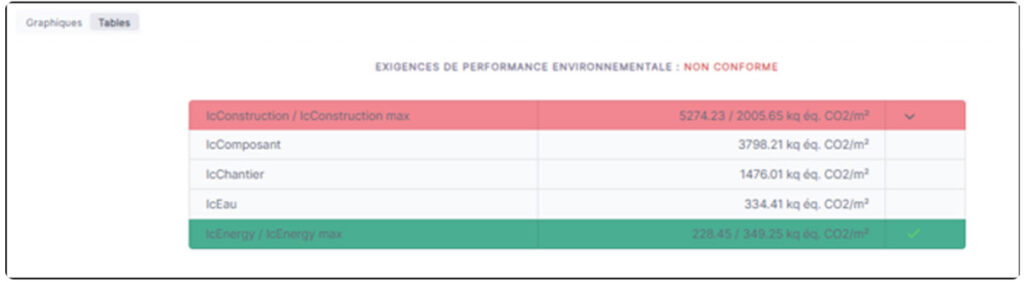
Table Result:
The various graphs proposed include:
Results for RE2020 and its different deadlines for IC Construction and IC Energy in graphical or table form:
All display formats are exportable, and a comprehensive report can be generated in Excel, PDF, or Word format.
// Carbonz in action
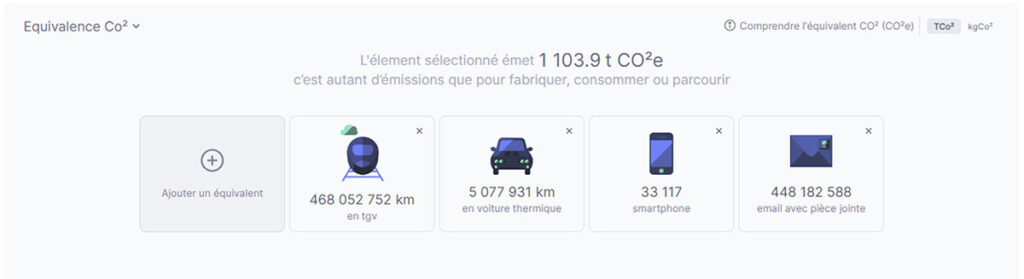
Visualization of CO² Equivalences
This display mode provides a pedagogical support for the total greenhouse gas emission result of the project.
Data from ADEME's IMPACT CO2 tool.
Establishing the RS2E File:
When the project is complete, Carbonz offers exporting RE2020 results in XML format. This information is available within the integrated GED on the platform.
This translation maintains technical precision while adapting to English-language conventions for BIM and LCA documentation. The content aligns structurally with previous sections while expanding on collaborative features and result visualization